Week 2
This week I firstly try to build my website. I have learned two new applications, which could help me easily create my website.
Bracket is an application which can help builders input and output their codes and give the codes styles. In Bracket, I can open two new files, one is index.html and another one is main.css. I will use index.html to input and output my codes to show my contents on my website while I will use main.css to give my website a style. To show my website style, I input an href class with the name of 'main.css' in index.html to link this two files.
FileZilla is an application which can help show your code inputed in Bracket on the website. Firstly, I link FileZilla with my website account. Then I create a new folder named public_html. I save my idex.html and main.css files, which are from Bracket, in the public_html folder. Finally, I drag these two files from local site to remote site. This help me see my website on the internet.
Week 3
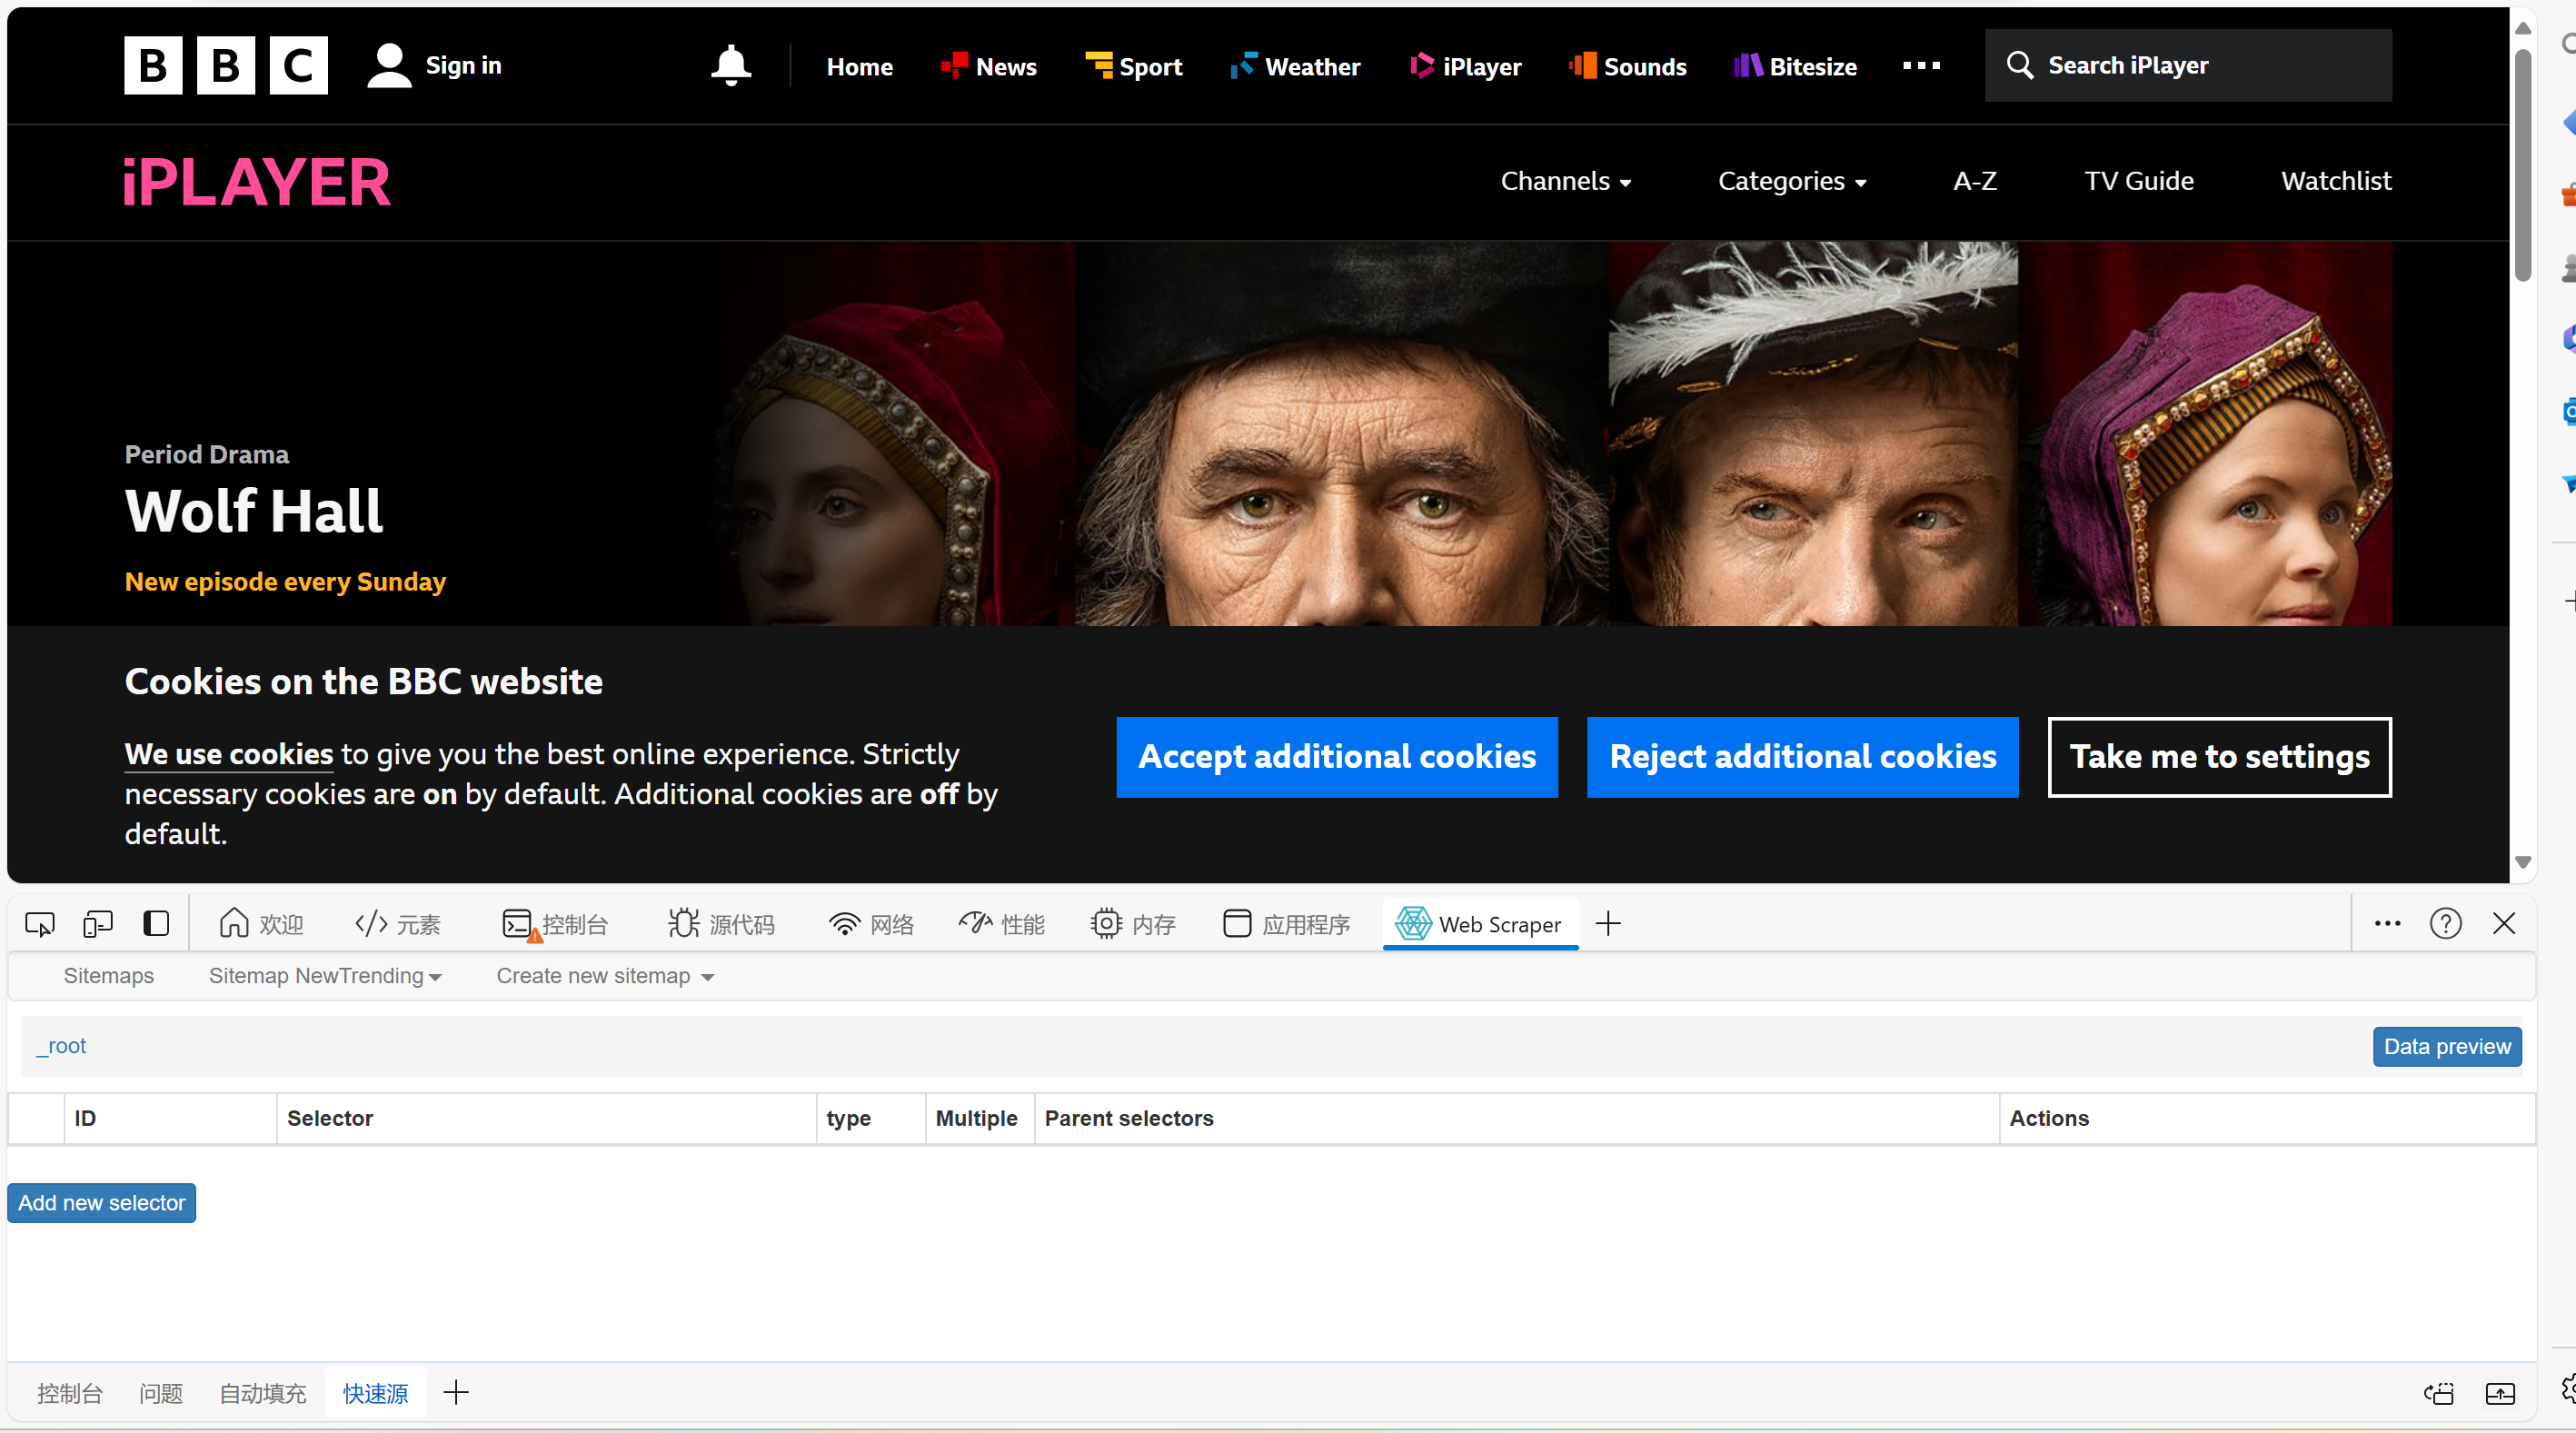
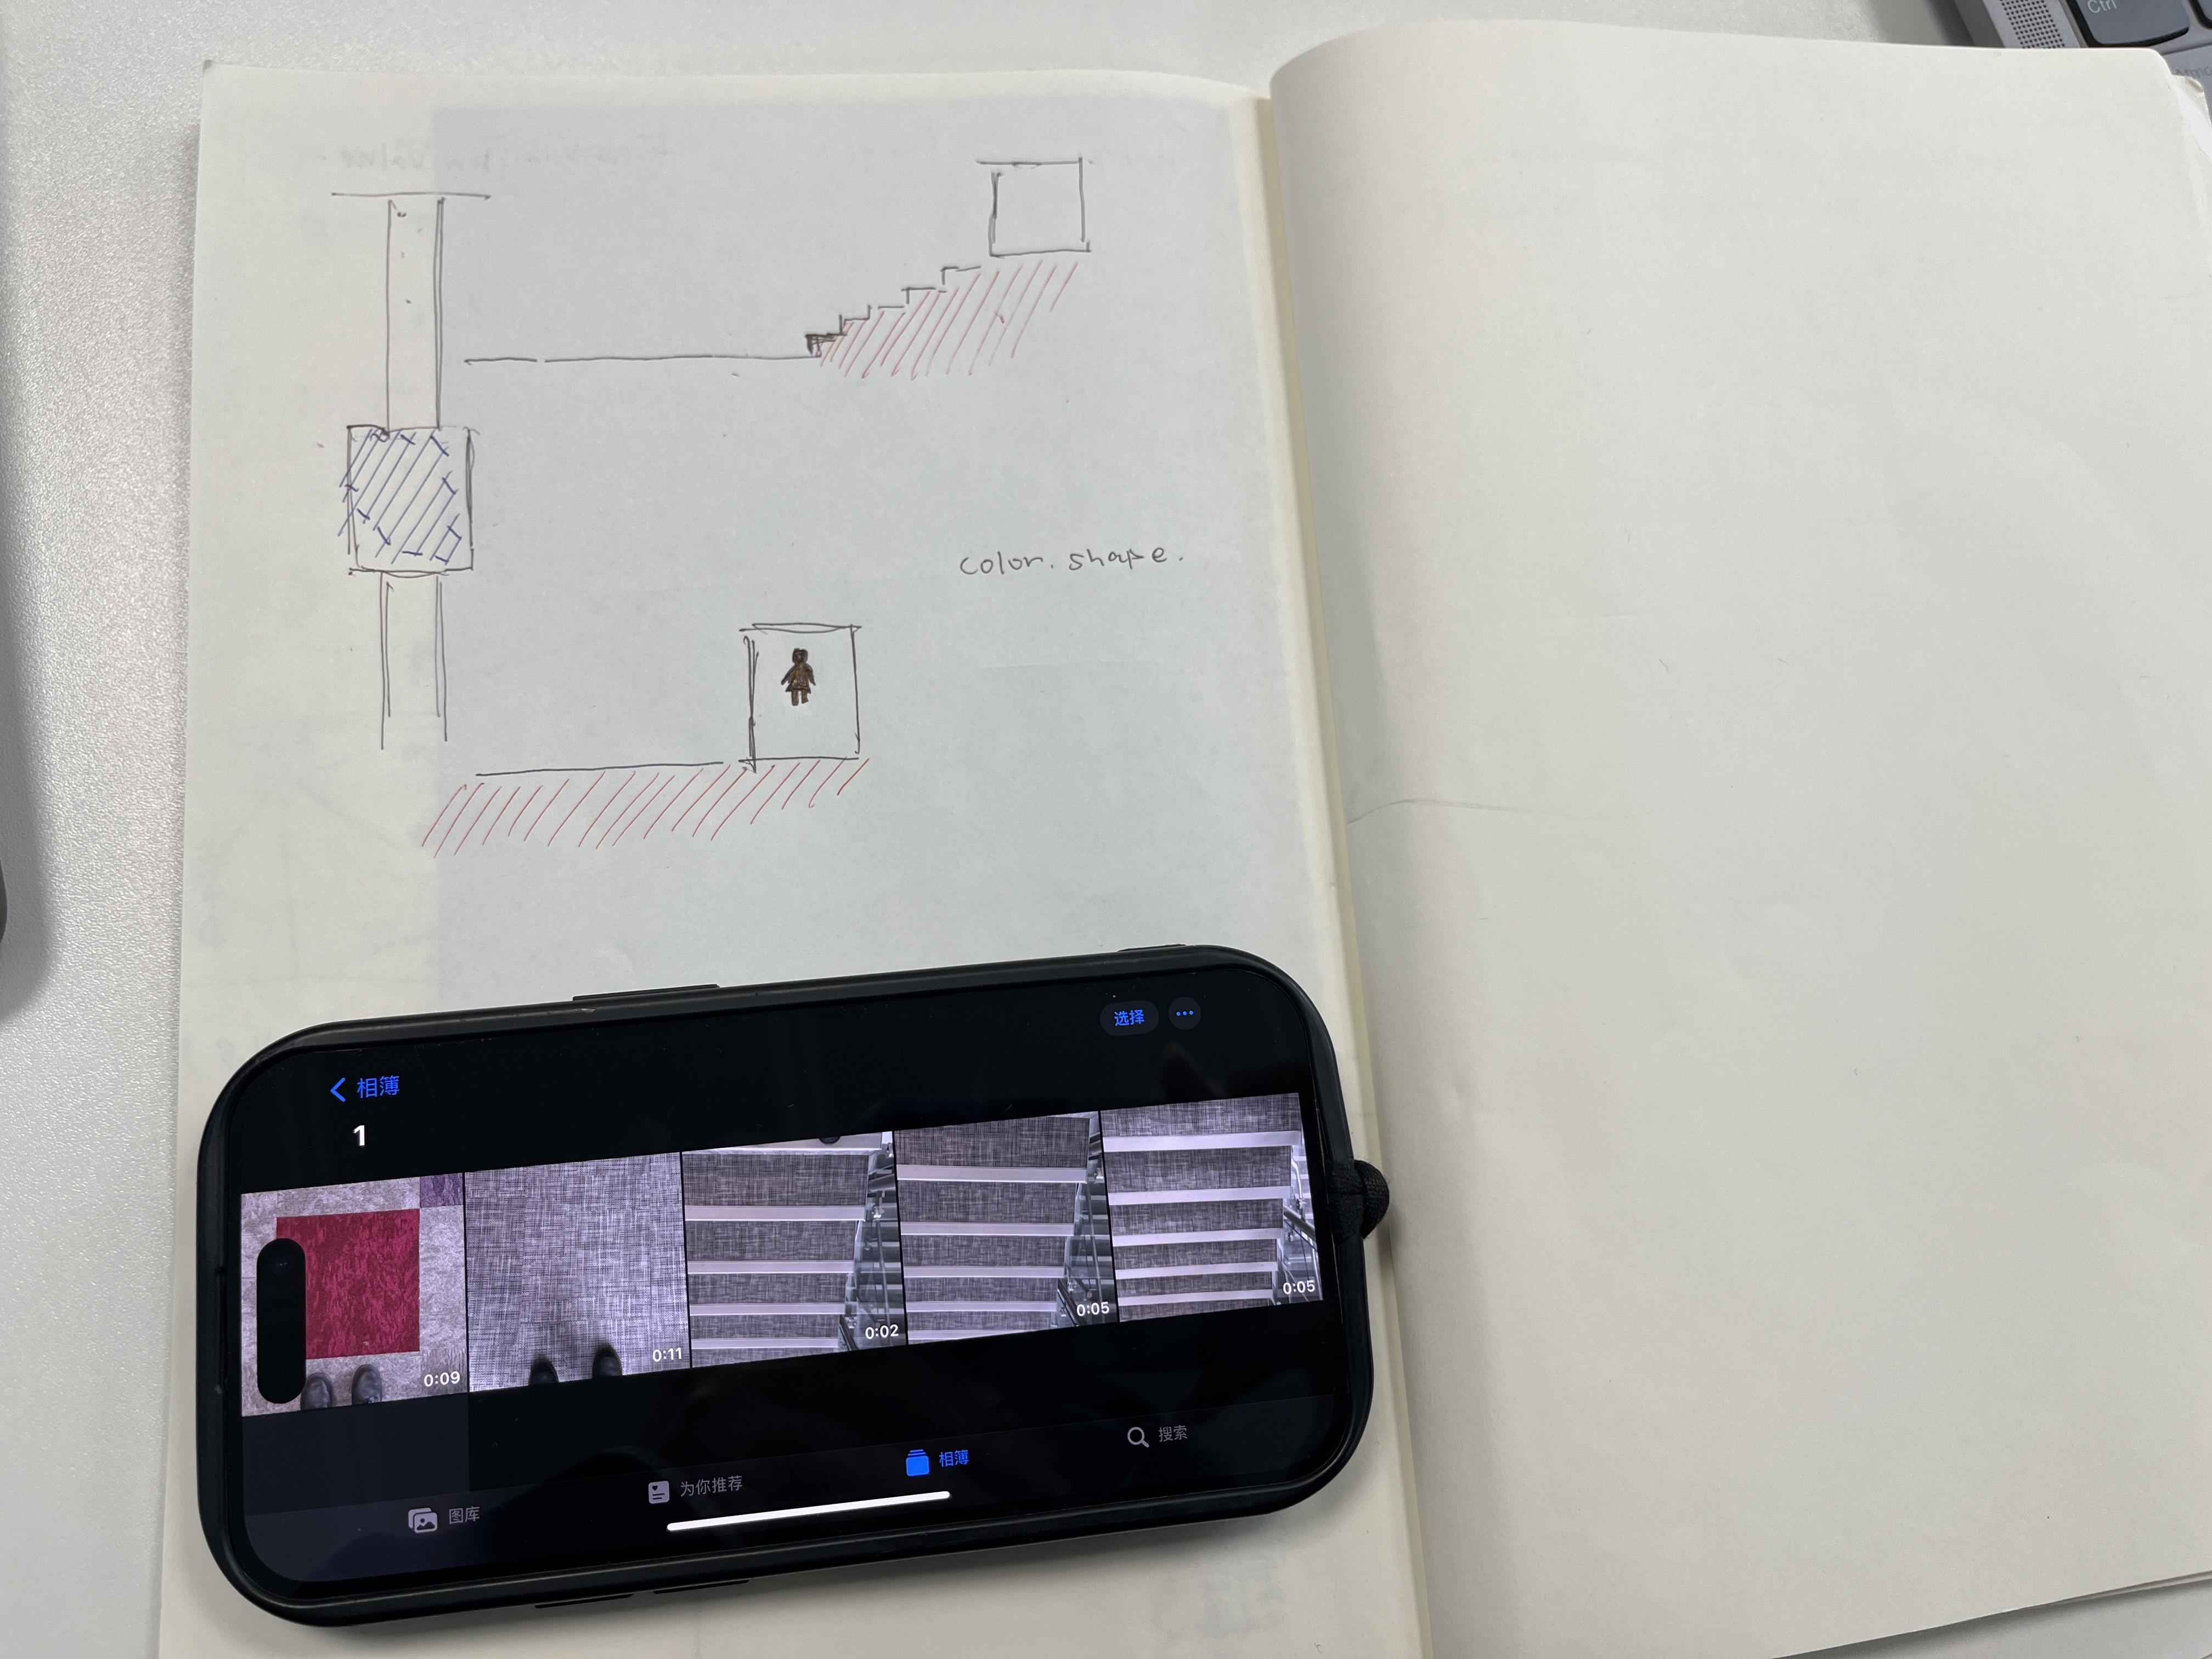
This week I learned how to do web scraping. First, I learned how to identify the code on the website. Next, I tried to use WebScraper.io to scrape codes. I installed https://webscraper.io. After that, navigate to the page I want to crawl. Right-click anywhere on the page, click Inspect, and a window opened. I found the Web Scraper tab and created a scraper. Under ‘Create a new sitemap’, enter the name I wanted to use and URL of the site I wanted to crawl. I click ‘Add New Selector’ to define the content of the page I wanted to capture.
Week 4
This week I had a group work with other three students. We chose Scenario 2: University-led Data Collection as our example. We found the data from StREAM@Leeds were multiple and comprehensive. We generated the question "How many people rewatch recorded video?" The variable could be gender, age, nationality and so on. Time was one of variables we chose. We divided our studying weeks into two parts, which were week 1 to week 2 and week 3 to week 4. The times we logged in studying systems were another variable we selected. We put our own data together to have a comparasion.
Week 5
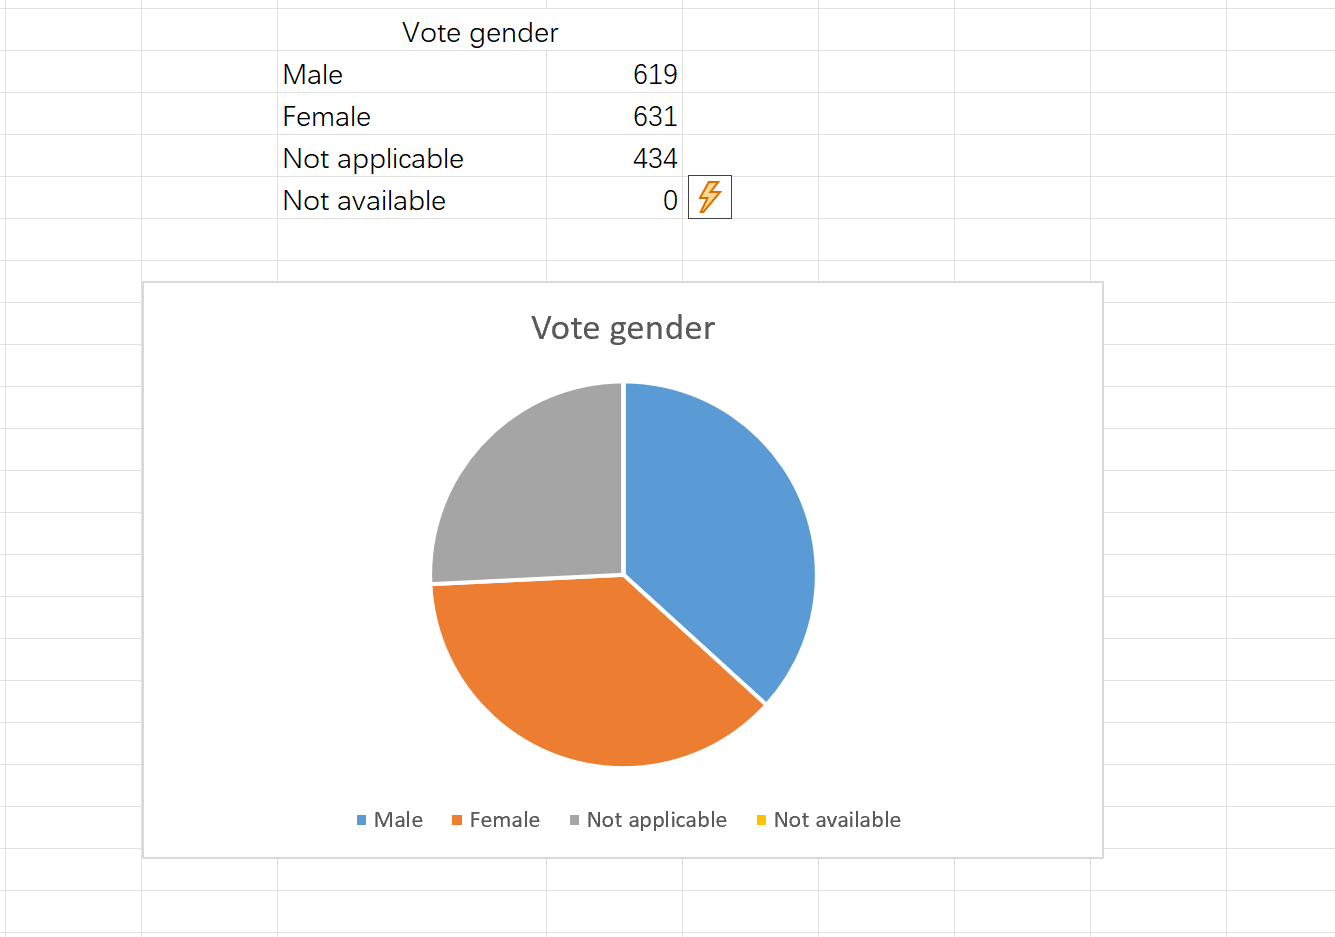
This week I learned how to generate charts in Excel. I selected rows and columns I wants to generate and clicked search. I put numbers, which were represented categories, in the search term. The times of the numbers occured were what I needed. I put the categories and times in a new table. Then I selected the rows and columns in the table and clicked right key to generate a table. This is a method of selecting data and make it more clearly.
Week 6
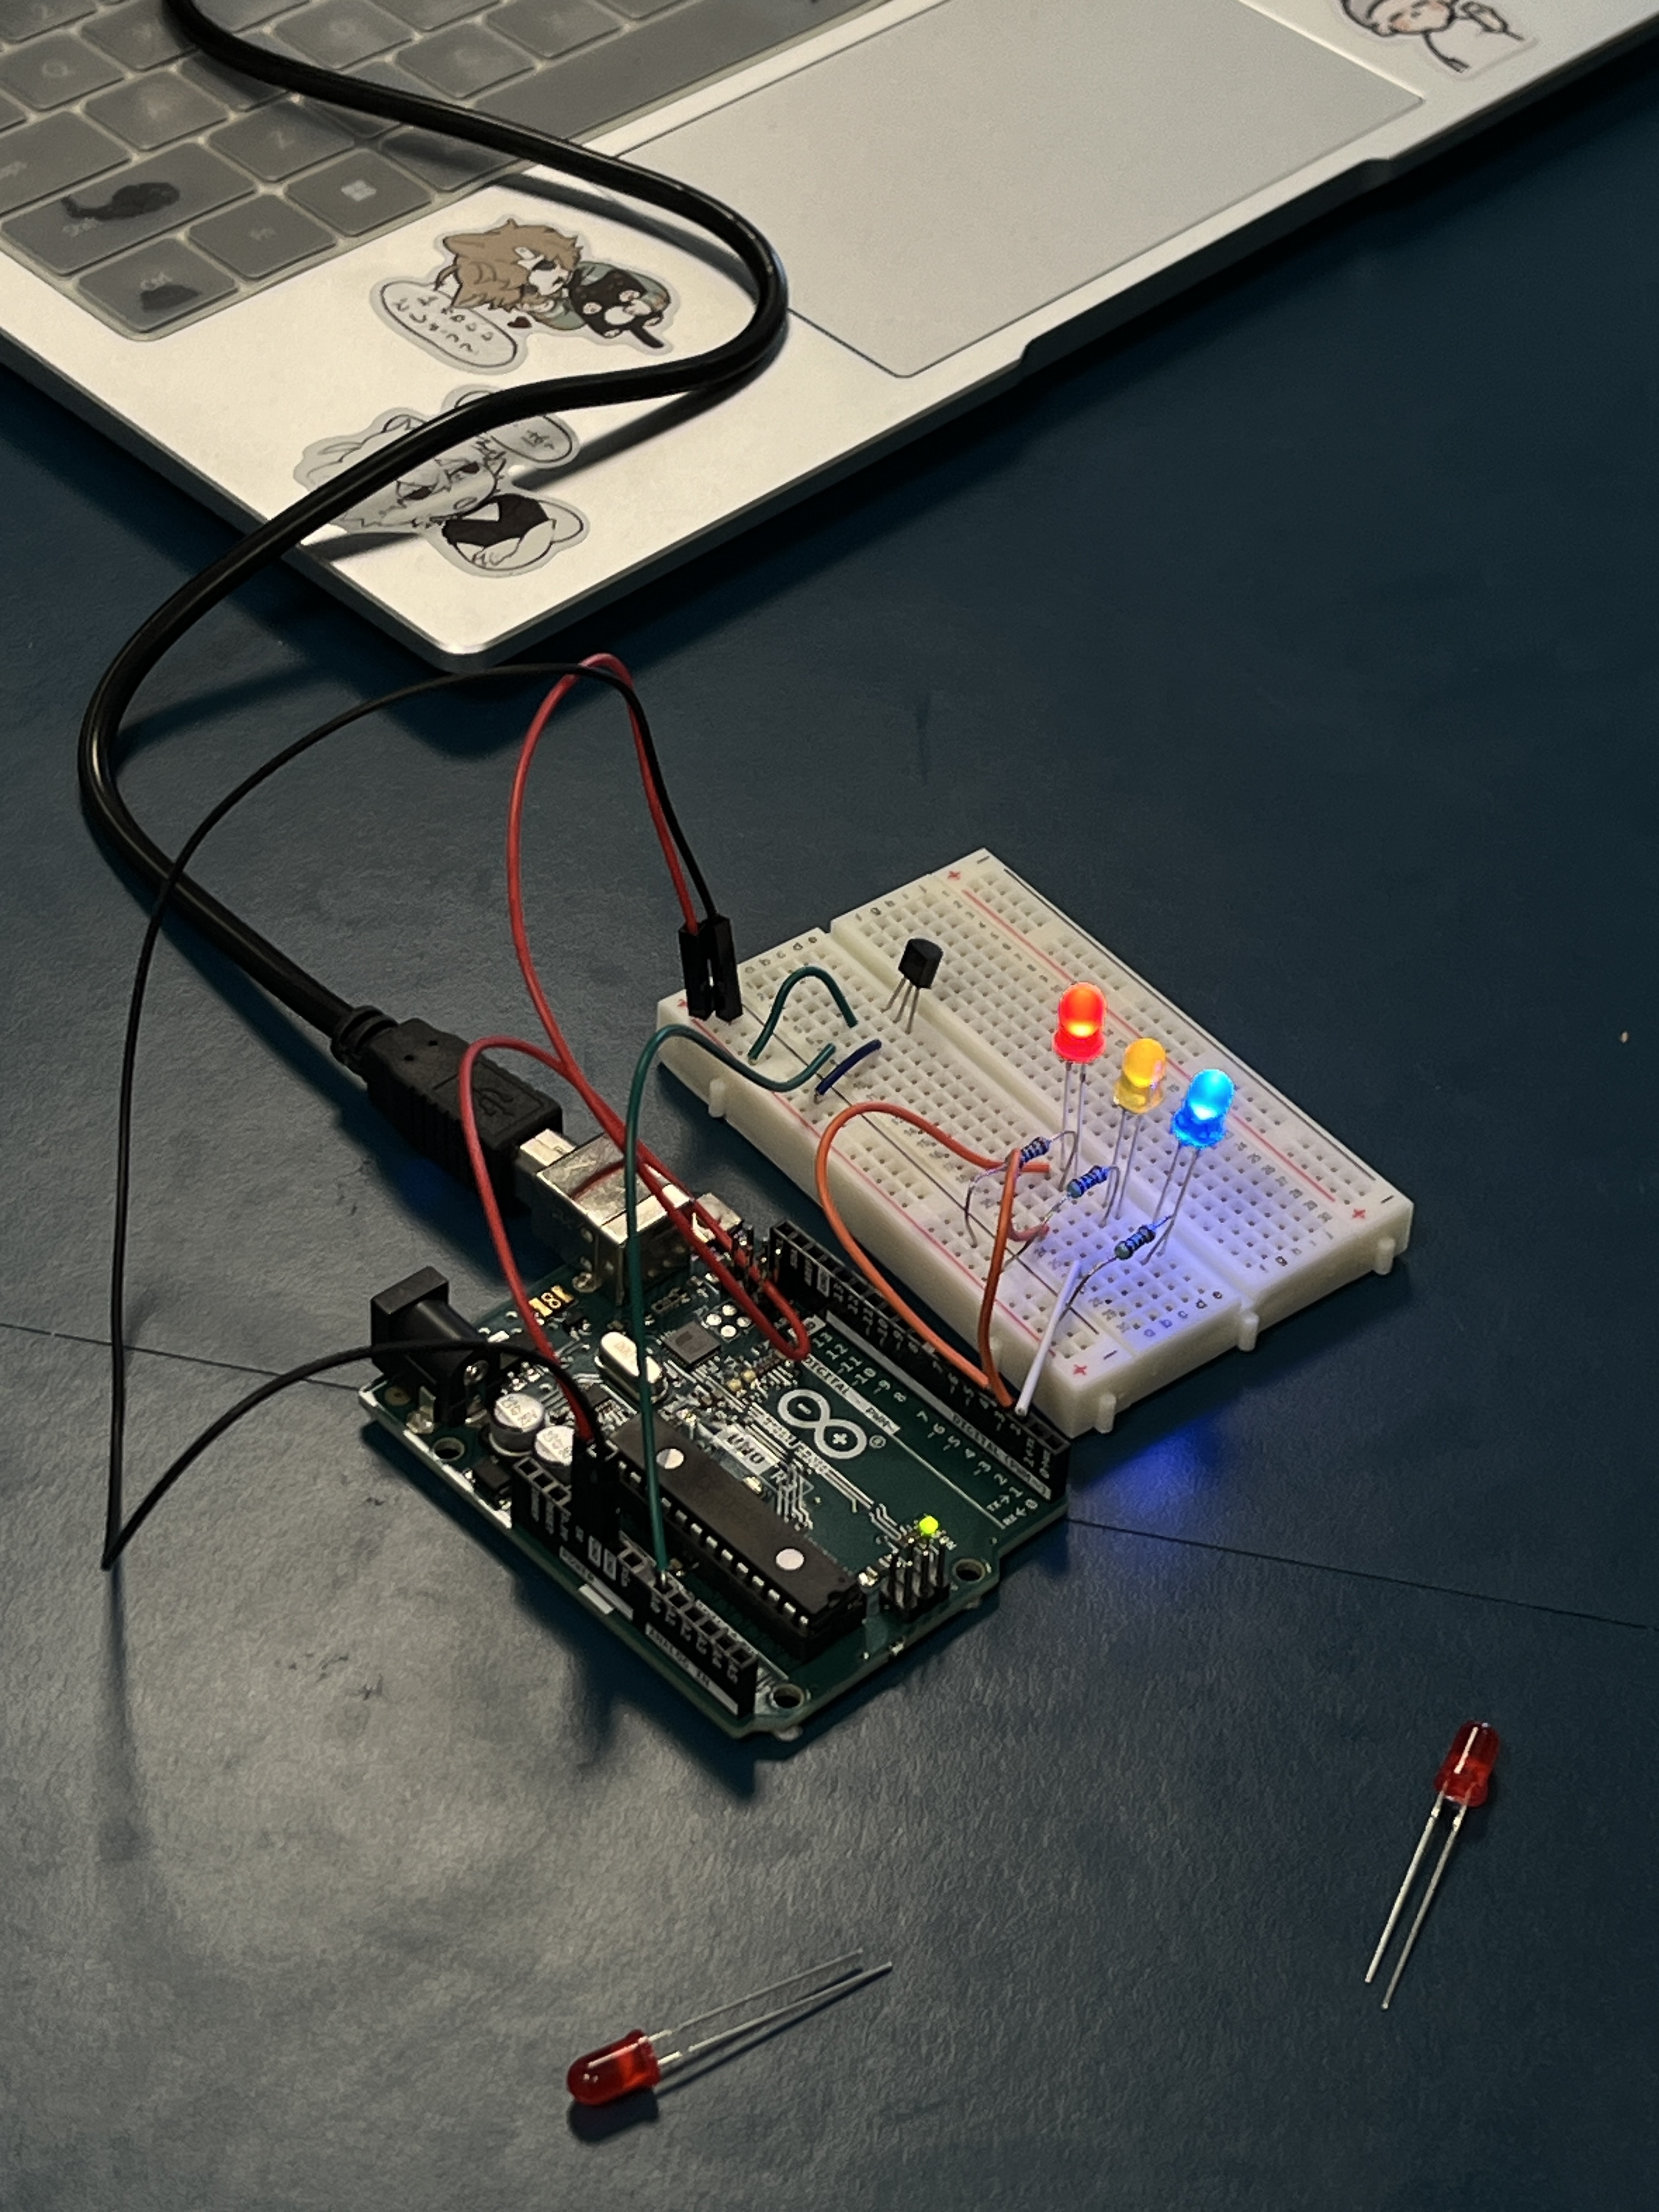

This week we used Arduino to create a hack. We work this as the pictures shown.
Week 7
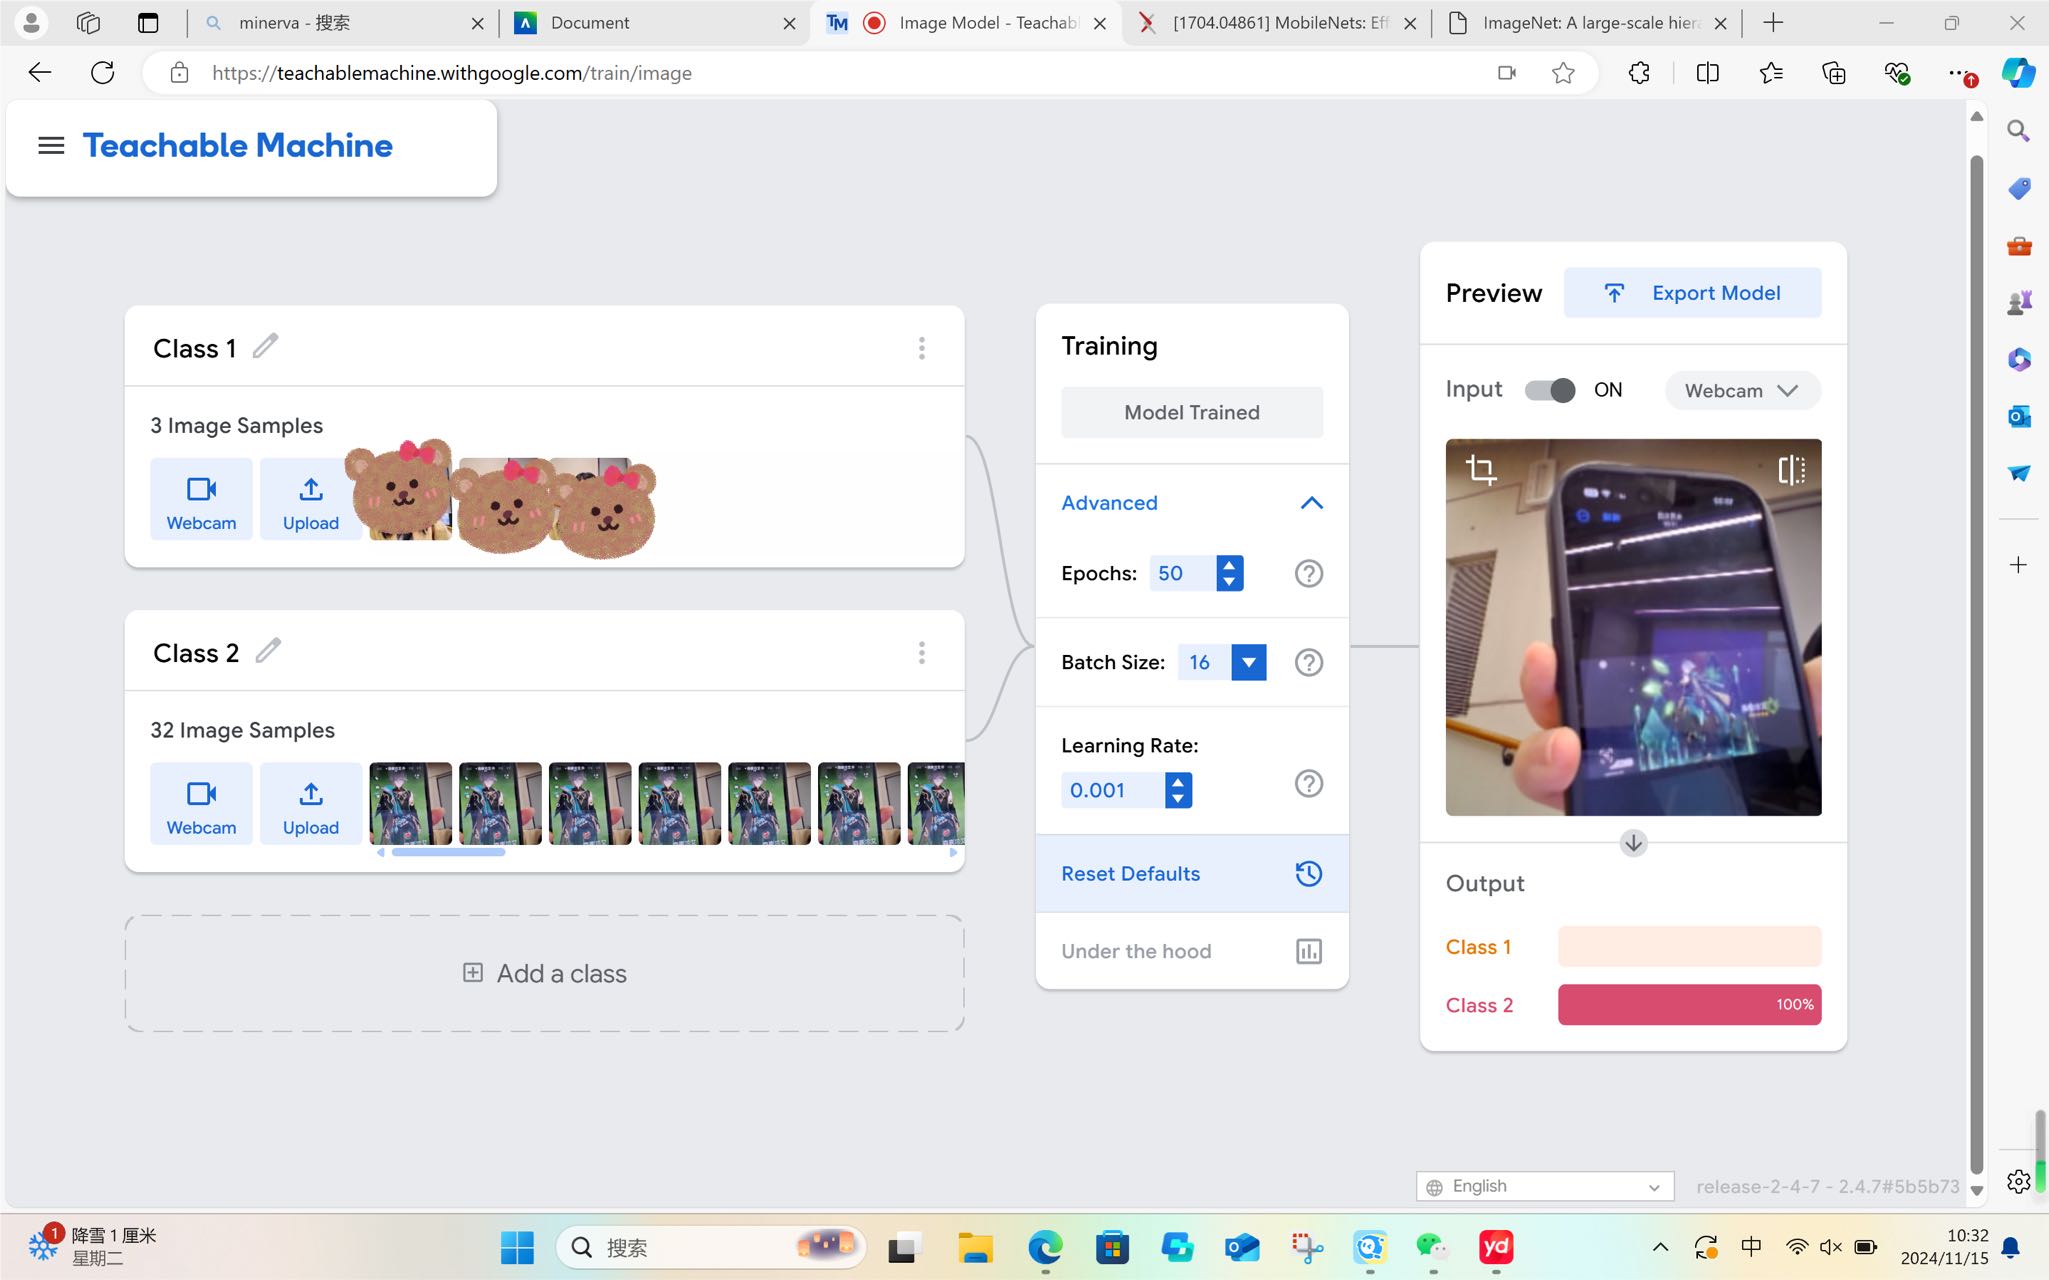
This week I tried Machine Learning. The plateform I used was Teachable Machine. It can identify images, audios, and pose. It was surpriesed me that it could identify one of my favorite ACG characters, Alhaitham. I only uploaded some vague pictures of him. When I showed my phone with his video on camera, the module could easily identify him.
Week 8
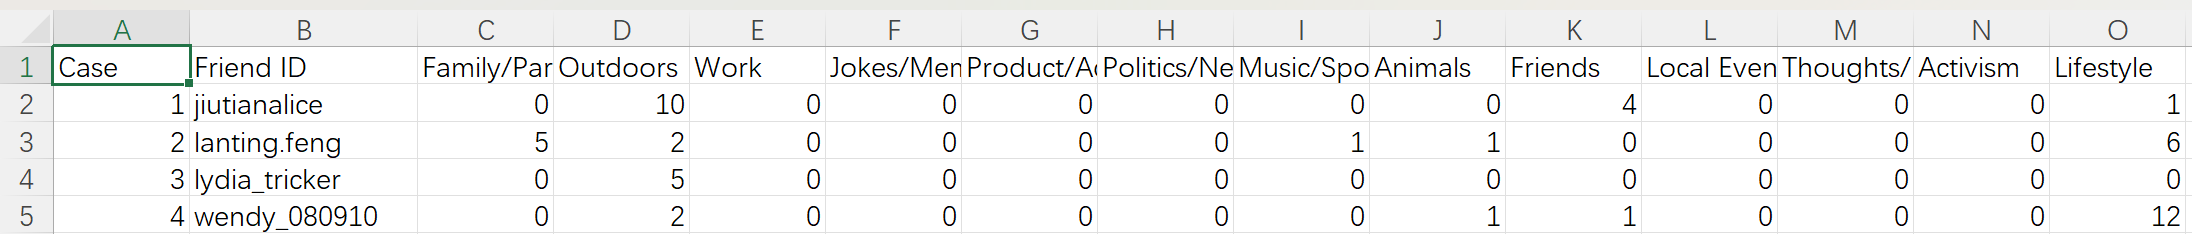
This week I learned how to input, output, and process data. The data was from my Ins account. According to the categories, it was clear that my friends, who are the same age as me, always output contents of Outdoors and Lifestyles. The table could show how data process clearly.
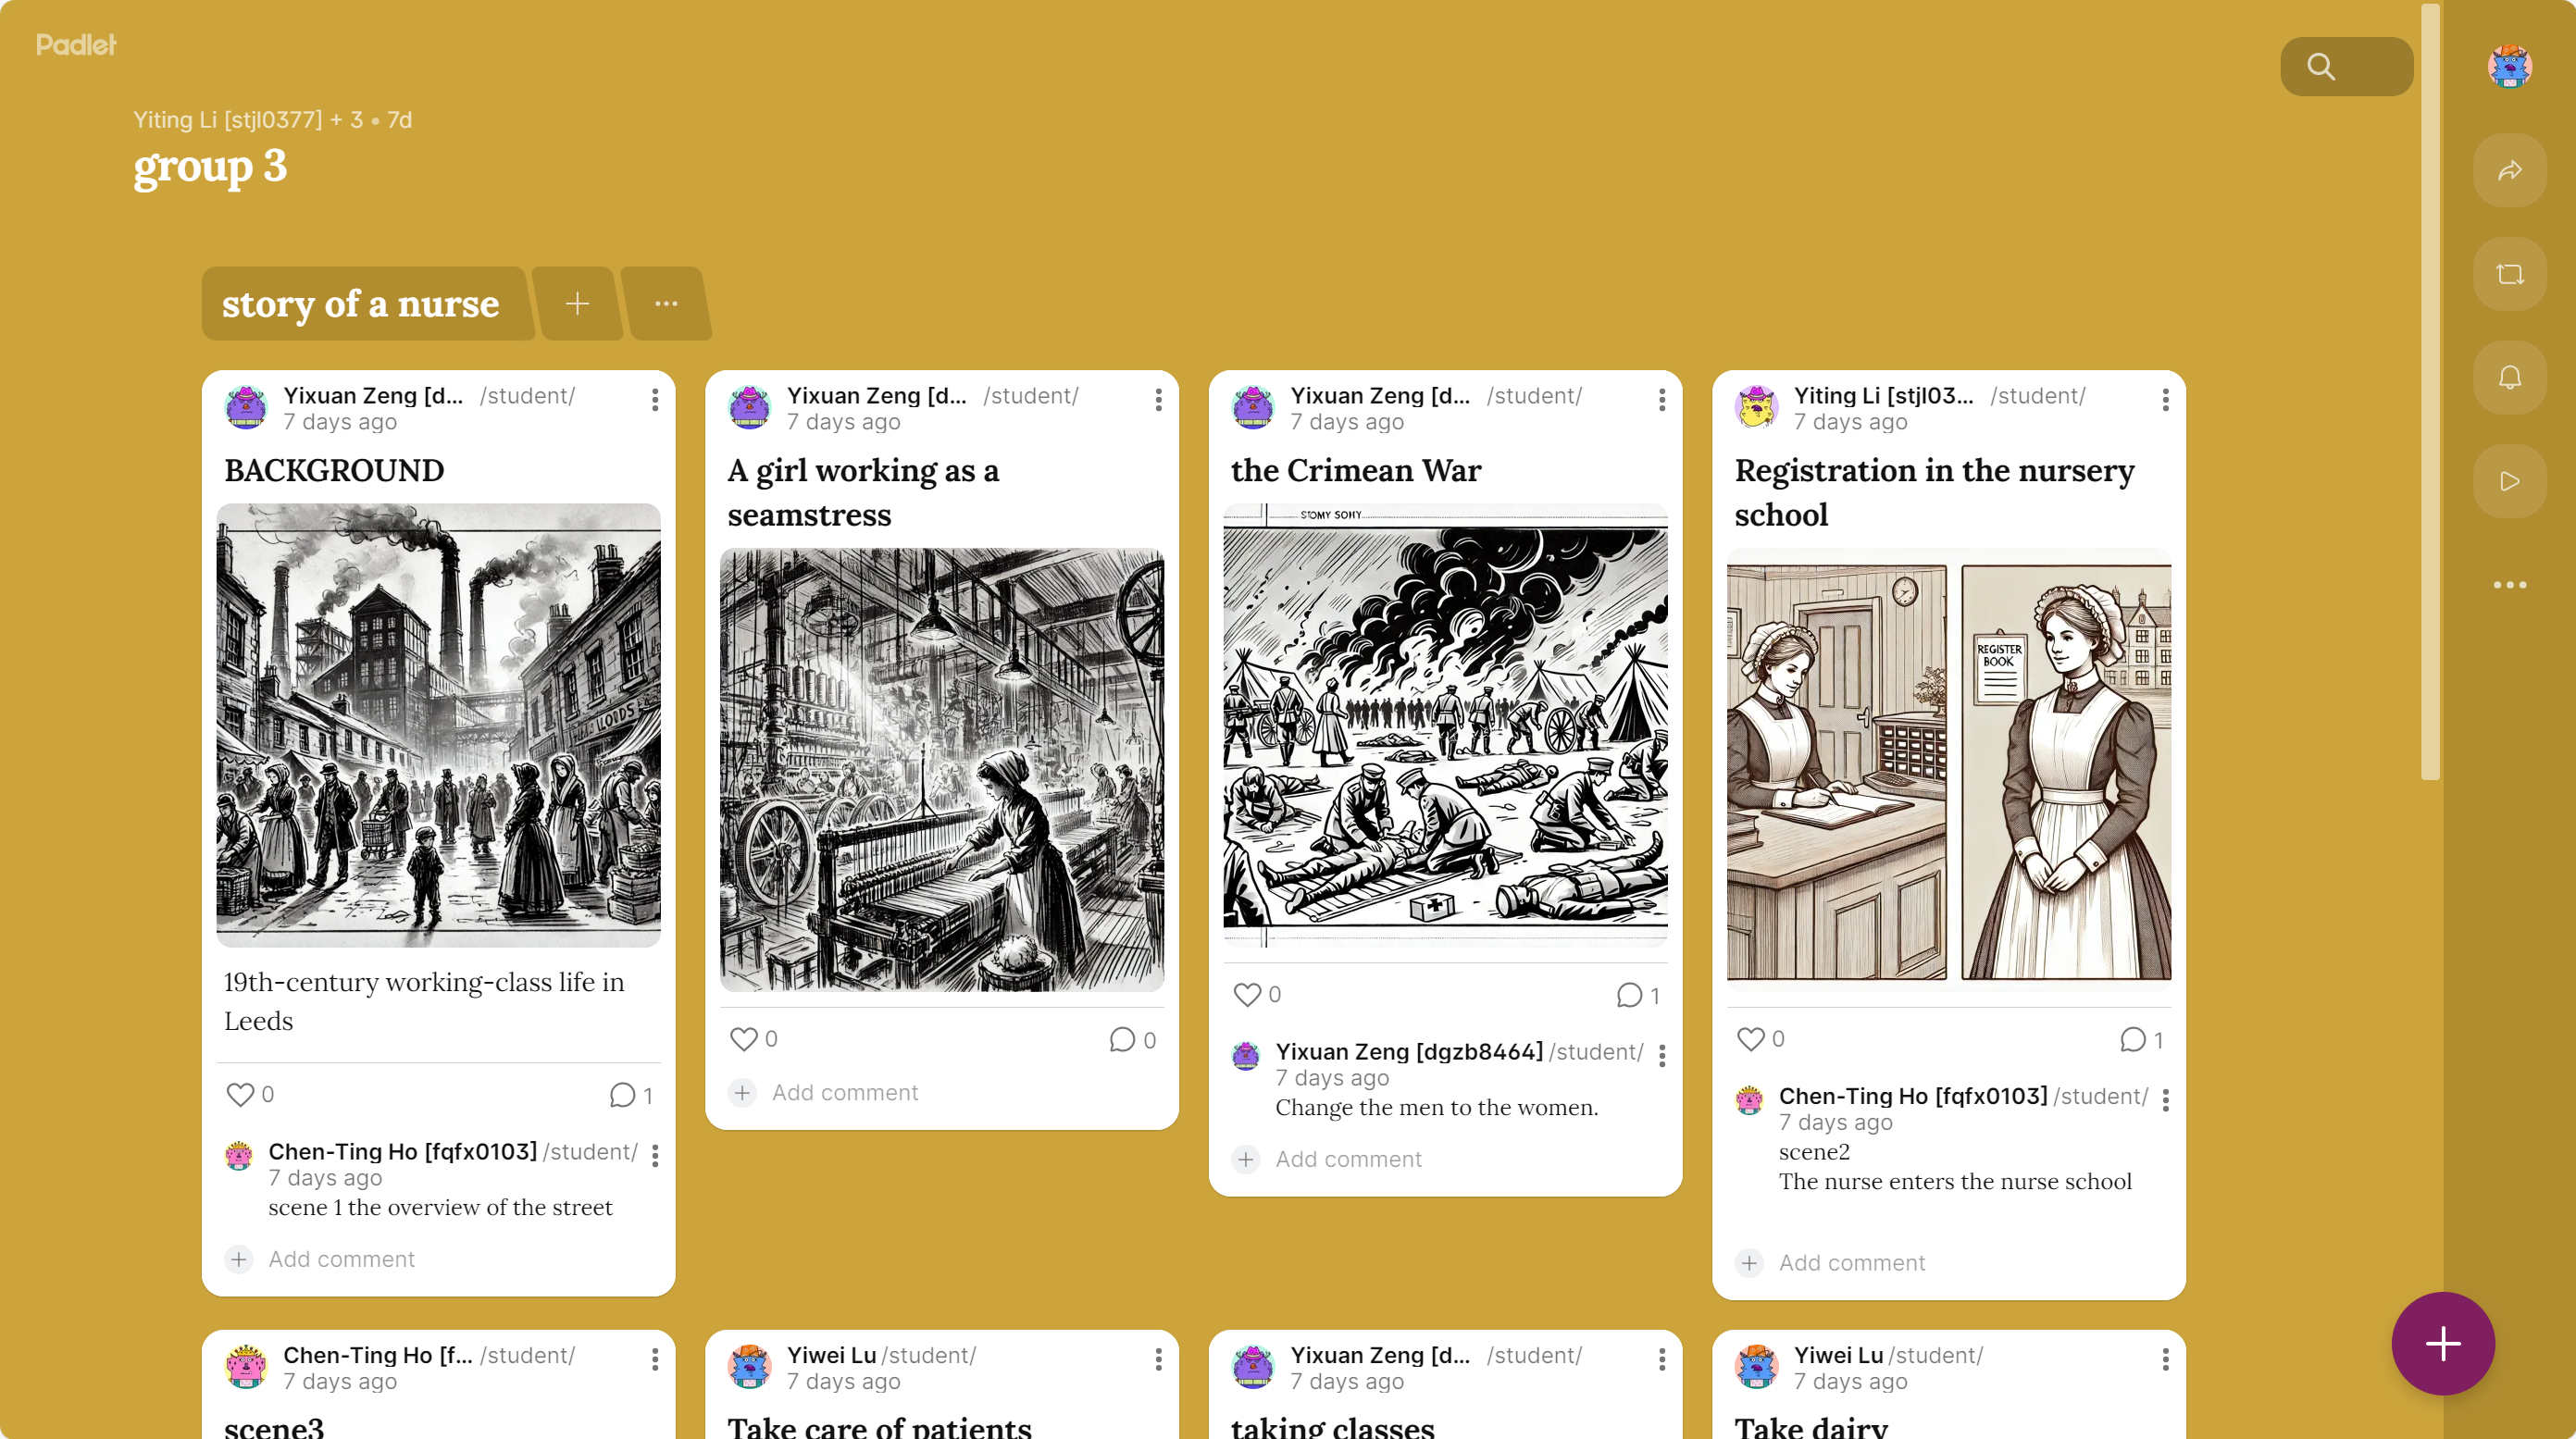
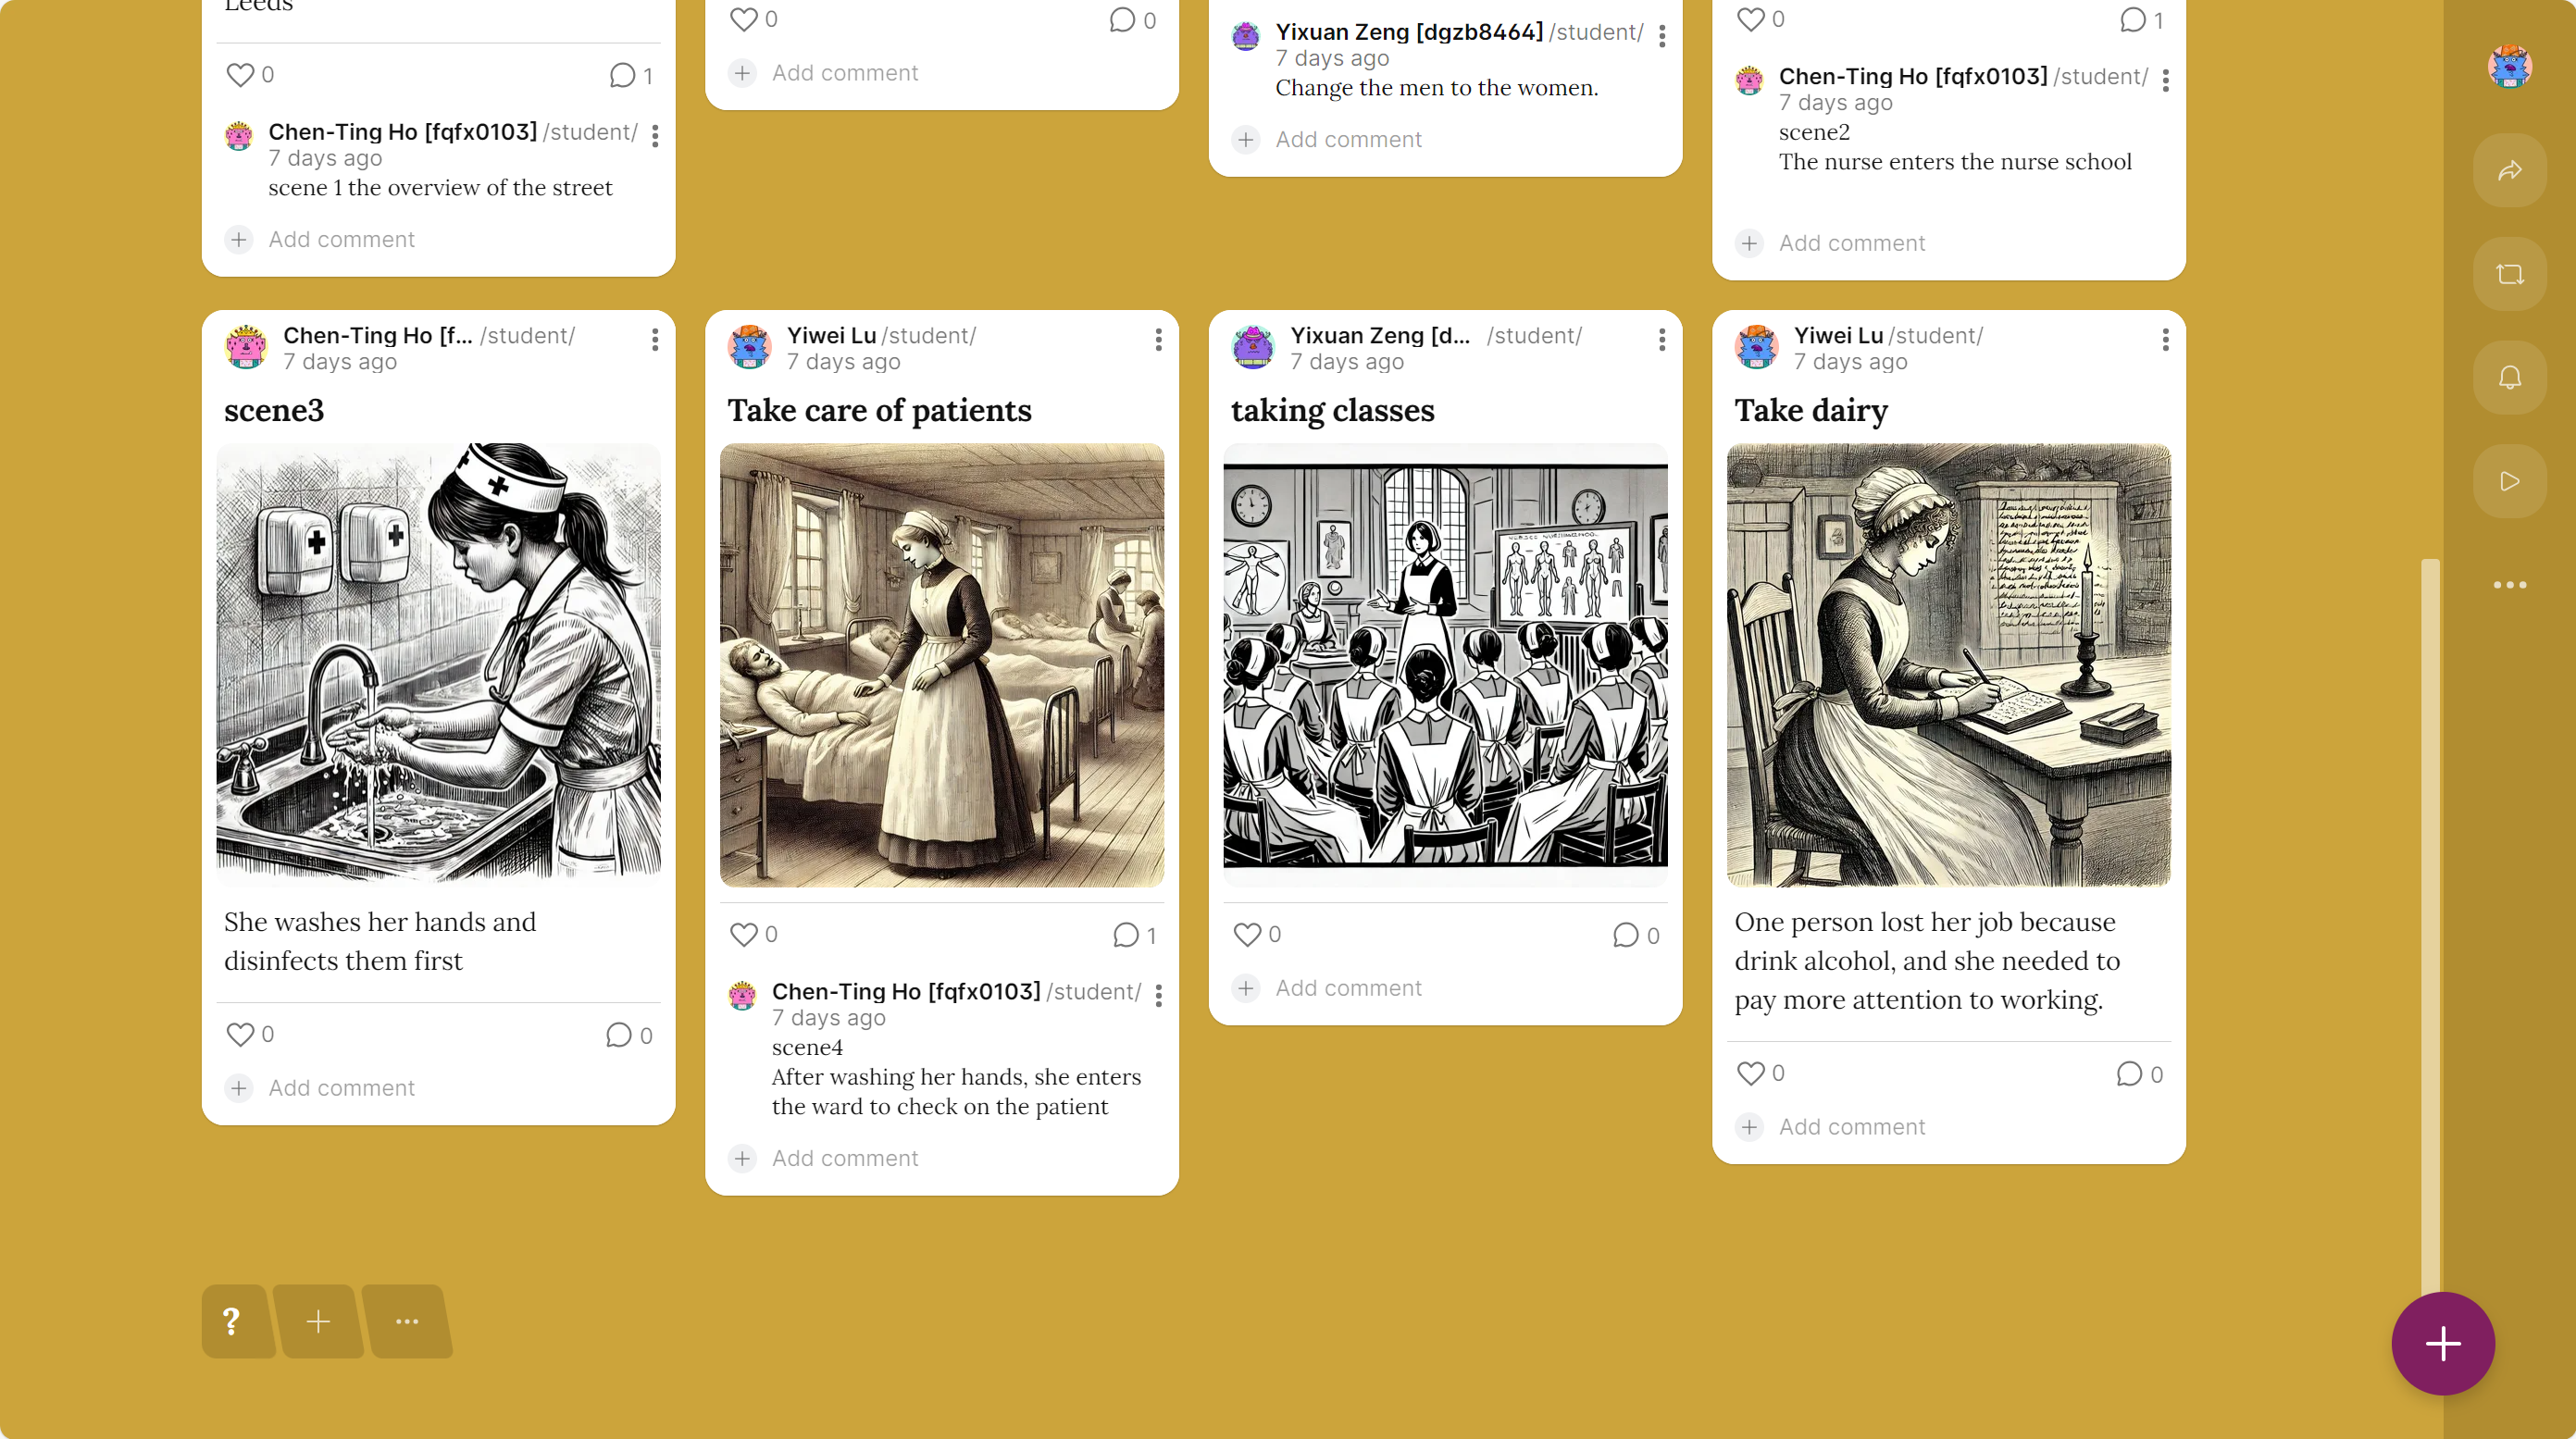
Week 15
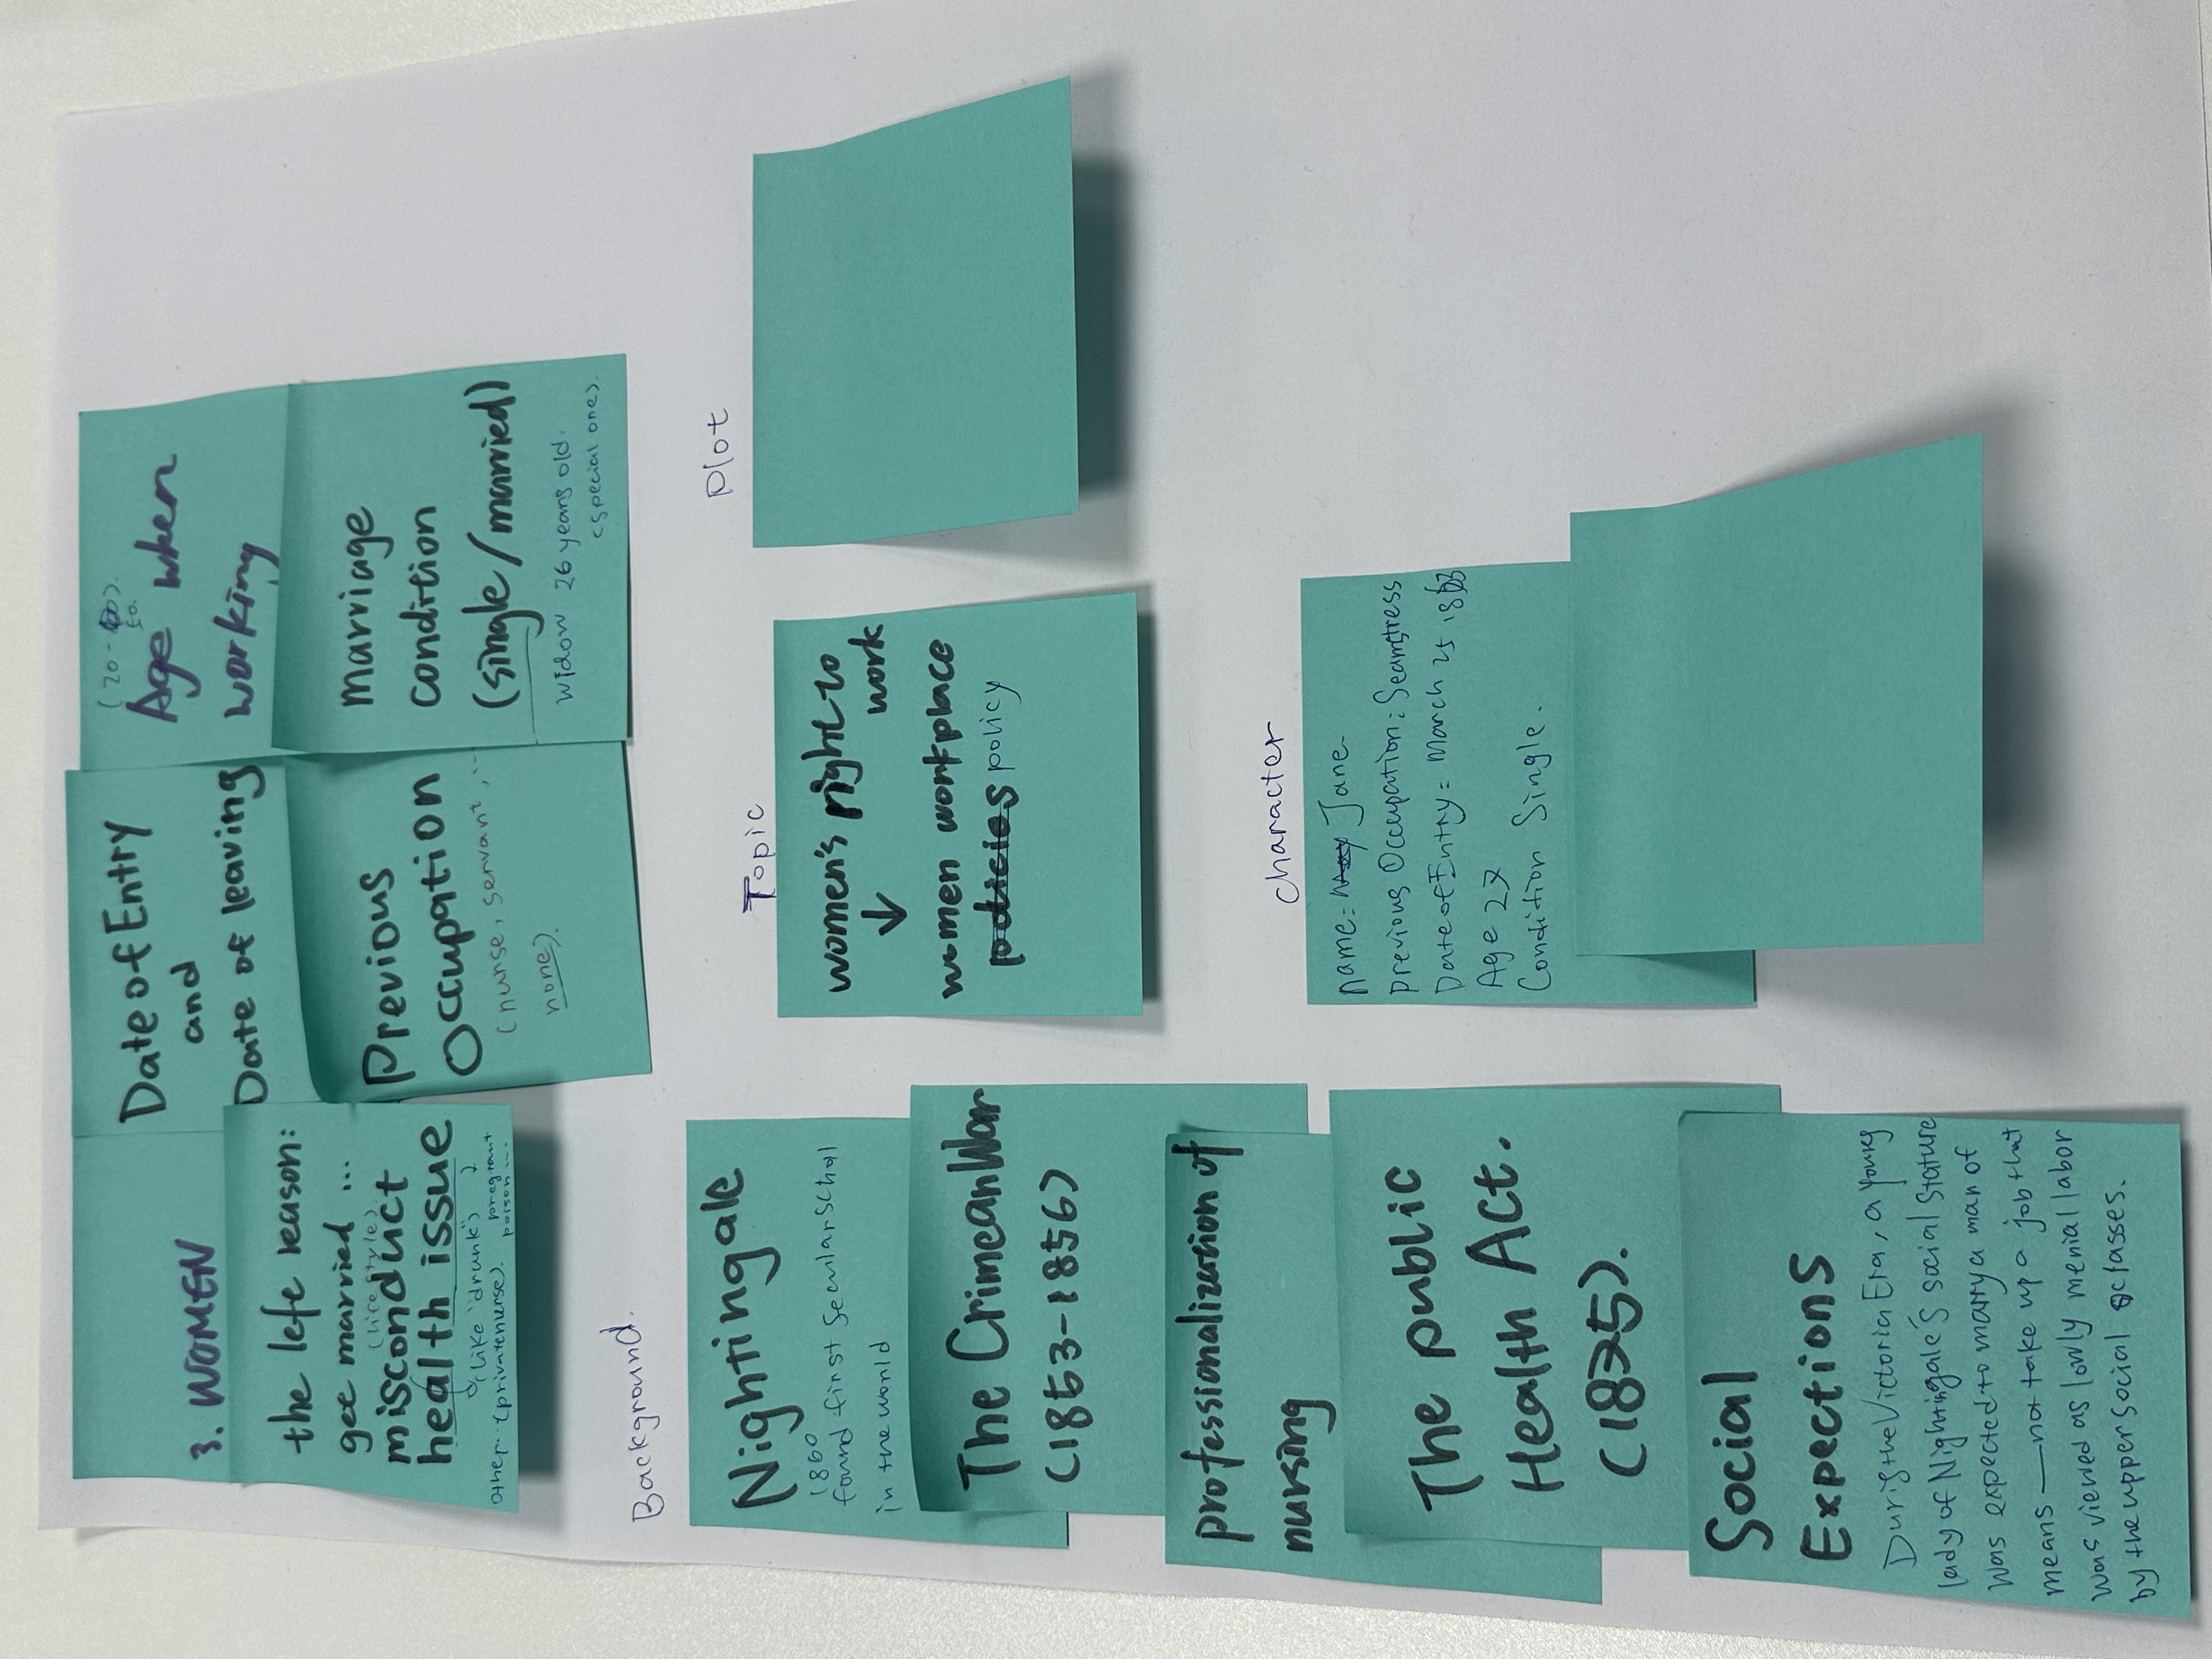
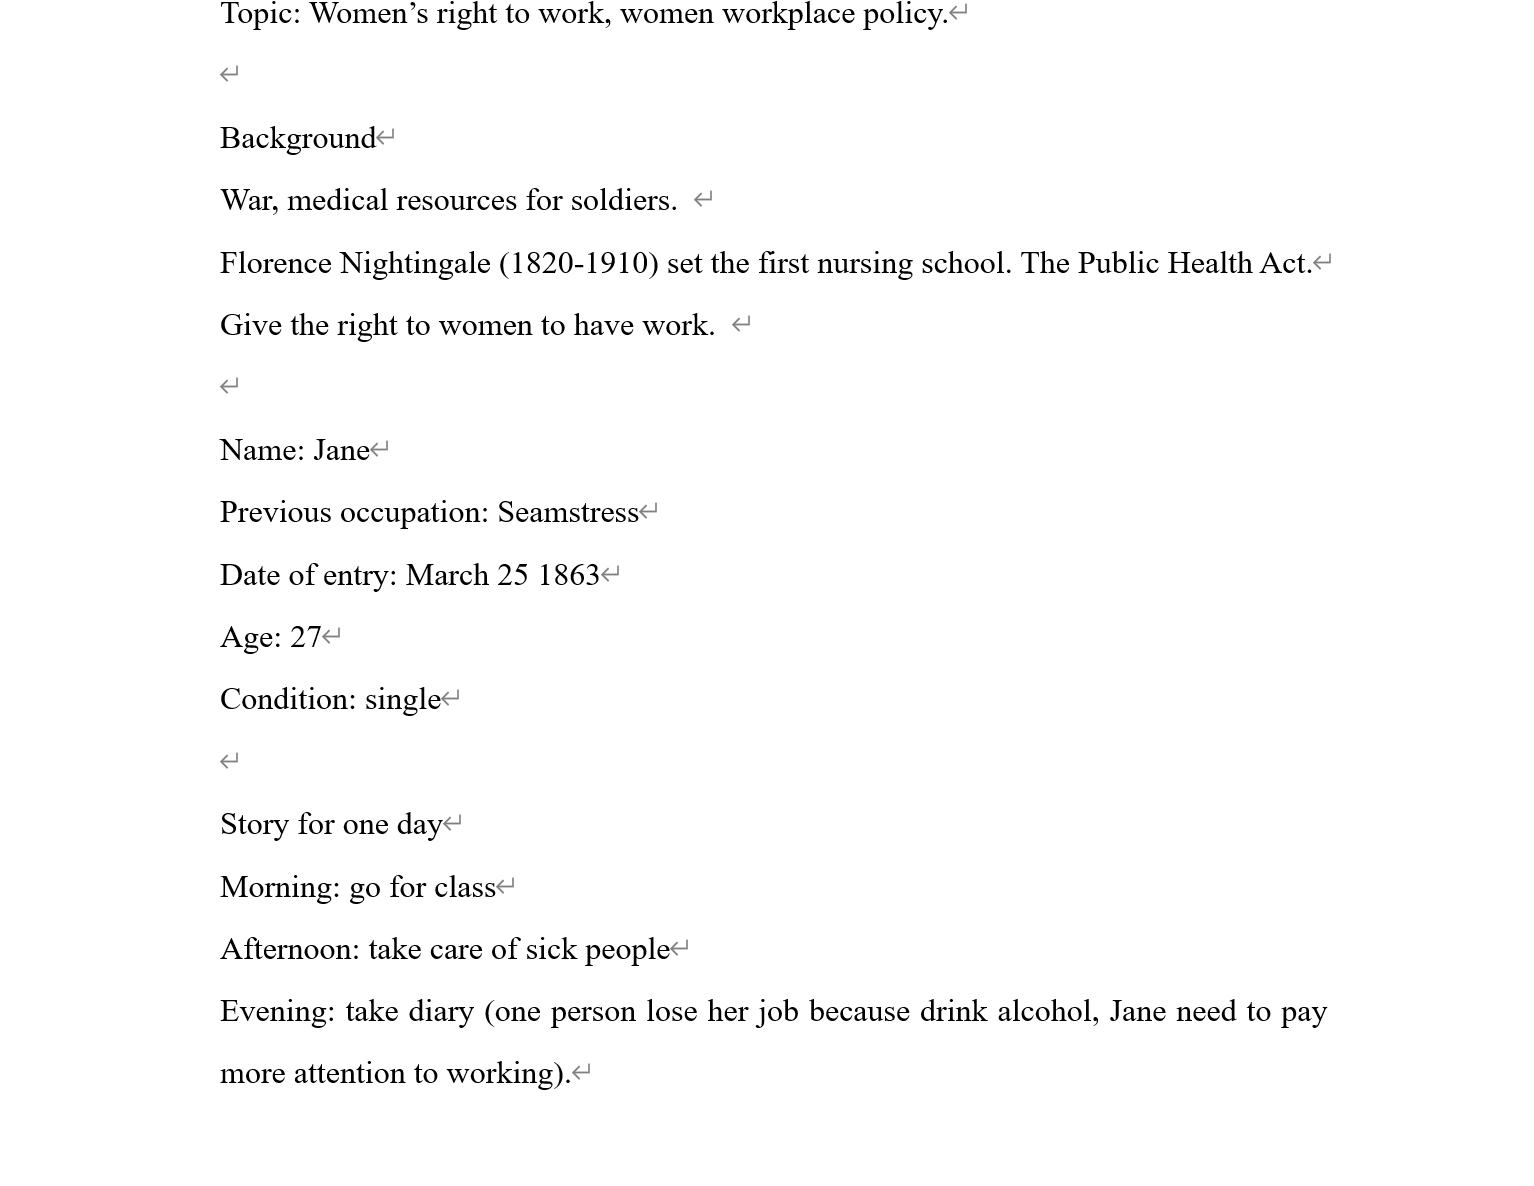
This week I collected data and wrote a story based on what we have seen in Week 14. We chose the data about women and right to work, especially about the nurse school. We generated the topic, background, and the plot. According to the pictures, the contents are about today's workshop.